React Native(Expo Managed)でグラフを表示したかった時に色々やったメモ書き。
大半はWebViewで苦戦する内容です。
React Native 0.60 Expo v34
ライブラリを使う
ライブラリは適当に探すだけでも結構見つかります。
ただExpo Managedでやろうと思うと意外とできない。
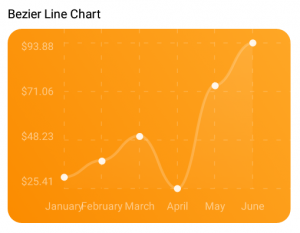
react-native-chart-kitはlinkコマンドなしでもいけそう。
|
1 |
yarn add react-native-chart-kit react-native-svg |
Quick Exampleを書いてみるとちゃんと表示されました。

Canvasを使う
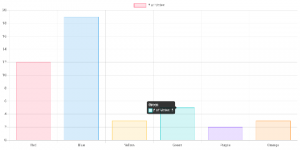
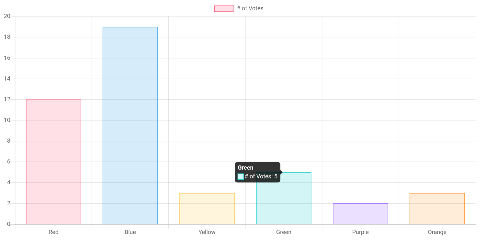
<canvas/>が使えればこれまでに使ったJSライブラリが使えるのではと思いつく。
react-native-canvasというのがあったので使ってみます。
|
1 |
yarn add react-native-canvas react-native-webview |
ドキュメントではlinkが必要そうですがしなくてもサンプルが動きました。
contextをとってきてチャート描画にChart.jsを使ってみます。
|
1 2 3 4 5 6 7 8 9 10 11 12 13 14 15 16 17 18 19 20 21 22 23 24 |
import Canvas from "react-native-canvas"; import Chart from "chart.js"; ... handleCanvas = canvas => { console.log(canvas.style); let ctx = canvas.getContext("2d"); new Chart(ctx, { type: "line", data: { datasets: [ { label: "Label", data: [11.8, 22, 15.5], borderColor: "rgba(255,0,0,1)", backgroundColor: "rgba(0,0,0,0)" } ] } }); }; ... <Canvas ref={this.handleCanvas} /> |
canvas.styleが見つからない?
ログを出してみると確かにundefinedになる。
…。
ソースを見て色々試してみてダメだったのでいっそ<WebView/>を使ってみます。
WebViewを使う
<WebView/>はreact-nativeのコンポーネントにもありますが、そのうちなくすのでreact-native-community/react-native-webviewを使ってほしいとのこと。
react-native-canvasを使う時に追加したやつですね。
|
1 2 3 4 5 6 7 8 9 10 11 12 13 14 15 16 17 18 19 20 21 22 23 24 25 26 27 28 29 30 31 32 33 34 35 36 37 38 39 40 41 42 43 44 45 46 47 |
const html = ` <html> <head></head> <body> <canvas id="canvas"/> </body> </html> `; ... handleCanvas = () => { let canvas = document.getElementById("canvas"); const ctx = canvas.getContext("2d"); try { new Chart(ctx, { type: "line", data: { labels: ["A", "B", "C"], datasets: [ { label: "Label", data: [11.8, 22, 15.5], borderColor: "rgba(255,0,0,1)", backgroundColor: "rgba(0,0,0,0)" } ] } }); } catch (e) { window.ReactNativeWebView.postMessage(e.message); } }; ... <WebView originWhitelist={["*"]} source={{ html }} injectedJavaScript={"let Chart=" + Chart.toString() + ";(" + this.handleCanvas.toString() + ")();";} onMessage={event => { console.log(event.nativeEvent.data); window.alert(event.nativeEvent.data); }} onError={syntheticEvent => { const { nativeEvent } = syntheticEvent; console.warn("WebView error: ", nativeEvent); }} /> |
injectedの中身を見てみるとこうなってた。こういう仕組みなのか。
|
1 2 3 4 |
let Chart = function Chart(item, config) { this.construct(item, config); return this; };... |
本体部分が渡されないと動くはずもないのでCDNで読み込むことにする。
|
1 2 3 4 5 6 7 8 9 |
const html = ` <html> <head></head> <body> <canvas id="canvas"/> <script src="https://cdnjs.cloudflare.com/ajax/libs/Chart.js/2.8.0/Chart.js"></script> </body> </html> `; |
また同じエラーが出る。
そういえば実行ブロックが違うのかwindowから参照する。
|
1 |
new window.Chart(ctx, {...}) |
ようやく動かすことが出来た。
(後々window部分を消しても動くようになったので直接原因ではないかも)
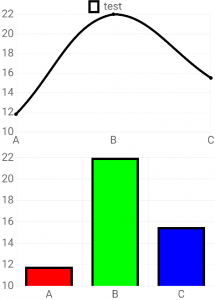
サンプルを動かしてみるとこんな感じになります。

フォントサイズとかいじらないと全く読めない。
WebViewでChart.jsを使うためのコンポーネントを適当に抜き出してみる。
|
1 2 3 4 5 6 7 8 9 10 11 12 13 14 15 16 17 18 19 20 21 22 23 24 25 26 27 28 29 30 31 32 33 34 35 36 37 38 39 40 41 42 43 44 45 46 47 48 49 50 51 52 53 54 55 56 57 58 59 60 61 |
import React, { Component } from "react"; import { View } from "react-native"; import { WebView } from "react-native-webview"; const html = ` <html> <head> <script src="https://cdnjs.cloudflare.com/ajax/libs/Chart.js/2.8.0/Chart.js"></script> </head> <body style="margin:0;"> <canvas id="canvas"/> </body> </html> `; const handleCanvas = (type, data, options) => { let canvas = document.getElementById("canvas"); let ctx = canvas.getContext("2d"); try { Chart.defaults.global.defaultFontSize = 48; var myChart = new Chart(ctx, { type: type, data: data, options: options }); return myChart; } catch (e) { window.ReactNativeWebView.postMessage(e.stack); } }; const defaultOptions = { maintainAspectRatio: false }; export default class MyChart extends Component { showChart = (type, data, options = defaultOptions) => { const code = `show("${type}",${JSON.stringify(data)},${JSON.stringify(options)});`; this.webview.injectJavaScript(code); }; componentDidMount() { this.webview.injectJavaScript("const show=" + handleCanvas.toString()); } render() { return ( <View style={{ flex: 1, alignSelf: "stretch" }}> <WebView style={{ flex: 1 }} originWhitelist={["*"]} source={{ html: html }} ref={ref => (this.webview = ref)} onMessage={event => { console.log(event.nativeEvent.data); }} onError={syntheticEvent => { const { nativeEvent } = syntheticEvent; console.warn("WebView error: ", nativeEvent); }} /> </View> ); } } |
使う側はtype, data, optionsを渡すだけ。
|
1 2 3 4 5 6 7 8 9 10 11 12 13 14 15 16 17 18 19 20 21 22 23 24 25 |
componentDidMount() { let data = { labels: ["A", "B", "C"], datasets: [ { label: "test", data: [11.8, 22, 15.5], backgroundColor: "rgba(0,0,0,0)", borderColor: "rgba(0,0,0,1)", borderWidth: 10 } ] }; this.chart1.showChart("line", data); data.datasets[0].backgroundColor = ["#F00", "#0F0", "#00F"]; this.chart2.showChart("bar", data, { maintainAspectRatio: false, legend: { display: false } }); } render() { return ( <View style={{ flex: 1, alignItems: "center", justifyContent: "space-between" }}> <MyChart ref={ref => (this.chart1 = ref)} /> <MyChart ref={ref => (this.chart2 = ref)} /> </View> ); } |

とりあえずこんな感じです。微調整すればいい感じになりそう。
